Db2 Provided Monitoring Facilities
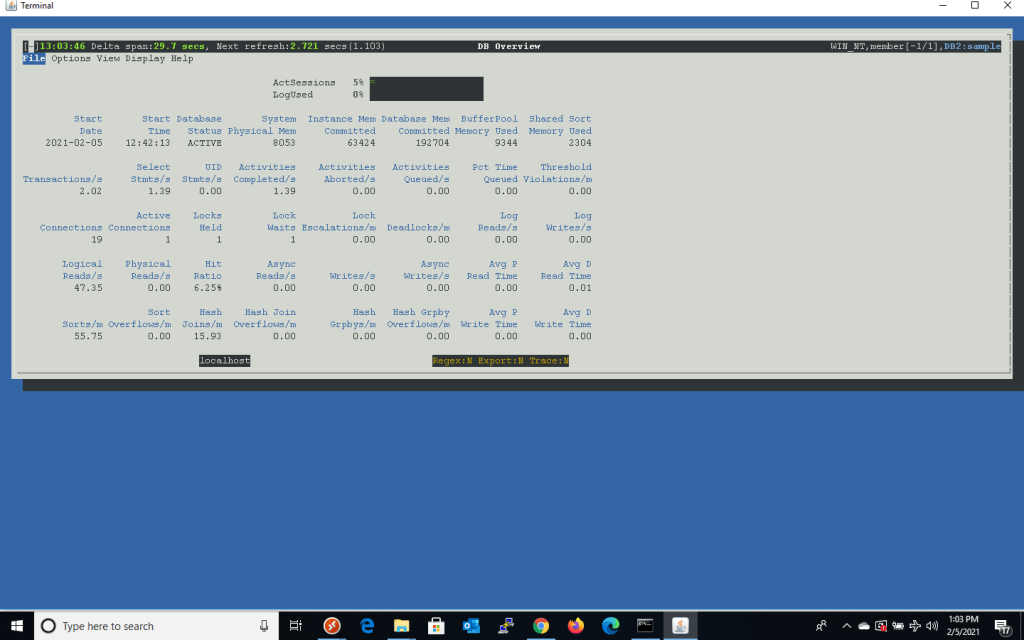
Besides being a stellar product, Db2 includes everything you need to monitor and tune Db2. I will point out 2 of these facilities in this post, and provide more info on additional capabilities in a later post. For point-based monitoring, Db2 provides for DSMTOP on Linux/UNIX and Windows platforms. It was formerly known as Db2top prior to DB2 10.1. DSMTOP uses the mon_get table functions as its source of performance data. DSMTOP is launched from the Db2 command line. It provides for monitoring of currently executing SQL, sessions and applications along with monitoring of Db2 memory areas and various caches. It can interface with db2explain and enhance SQL tuning. You can use it to identify locking issues and long running SQL. It is a great free tool and you should become familiar with it. Below is an example of a DSMTOP screen show DB level information.

Get more info on it here: https://www.ibm.com/support/knowledgecenter/SSEPGG_11.5.0/com.ibm.db2.luw.admin.cmd.doc/doc/r0070123.html.
The MONREPORT reporting tool is very handy for identifying currently running SQL with various top 10 rankings in terms of CPU, IO and Wait time. You can use it to grab suspect running SQL and feed it to an explain and can also farm the package cache for dynamic and static SQL statements. Below is a brief example of some output provided:
Result set 1
TEXT
Monitoring report – current SQL
Database: GC_PROD
Generated: 02/05/2021 12:48:42
— Command options —
MEMBER: All
================================================================================
Part 1 – Summaries by ‘top’ metrics
Top 10 current activities by TOTAL_CPU_TIME
ACTIVITY UOW_ID APPLICATION TOTAL_CPU STMT_TEXT
_ID _HANDLE _TIME
——– —— ———– ——— ————————————–
1 1 12030 209103740 SELECT DATE(MAX(lt.Time)) AS “Date” ,
1 1 5095 0 CALL monreport.currentsql()
63 1 5095 0 SELECT ARRAY_AGG(A.ACTIVITY_ID ORDER B
1 20 10770 0 SELECT Acc_Num, Segment_Code, Type, Se
Top 10 current activities by ROWS_READ
ACTIVITY UOW_ID APPLICATION ROWS_READ STMT_TEXT
_ID _HANDLE
——– —— ———– ————- ———————————-
1 1 12030 0 SELECT DATE(MAX(lt.Time)) AS “Date
63 1 5095 0 SELECT ARRAY_AGG(A.ACTIVITY_ID ORD
1 20 10770 0 SELECT Acc_Num, Segment_Code, Type
1 1 5095 0 CALL monreport.currentsql()
Top 10 current activities by DIRECT READS + DIRECT WRITES
ACTIVITY UOW_ID APPLICATION DIRECT_READS + STMT_TEXT
_ID _HANDLE DIRECT_WRITES
——– —— ———– ————– ———————————
1 1 12030 0 SELECT DATE(MAX(lt.Time)) AS “Dat
63 1 5095 0 SELECT ARRAY_AGG(A.ACTIVITY_ID OR
1 20 10770 0 SELECT Acc_Num, Segment_Code, Typ
1 1 5095 0 CALL monreport.currentsql()
================================================================================
Part 2 – Overall ranking of activities
ACTIVITY UOW_ID APPLICATION TOTAL_CPU ROWS_READ DIRECT_READS +
_ID _HANDLE _TIME DIRECT_WRITES
——– —— ———– ——— ————- ———————-
1 1 12030 1 1 1
1 1 5095 2 1 1
1 20 10770 2 1 1
Output from the pkgcache option of monreport:
^C
C:\Program Files\IBM\SQLLIB_01\BIN>db2 call monreport.pkgcache |more
Result set 1
TEXT
Monitoring report – package cache
Database: GC_PROD
Generated: 02/05/2021 12:50:35
— Command options —
CACHE_INTERVAL: All statements
SECTION_TYPE: Dynamic and static SQL
MEMBER: All
================================================================================
Part 1 – Summaries by ‘top’ metrics
Top 10 statements by TOTAL_CPU_TIME
# TOTAL_ STMT_TEXT
CPU_TIME
— ———– —————————————————————
1 60808862119 with a as ( select b.CASINO_ID ProductCode ,case b.CASINO_I
2 54956843451 with a as ( select b.CASINO_ID ProductCode ,case b.CASINO_I
3 14570462338 SELECT given_name, family_name, username, ca.LOCK AS ACC_LOCK,
4 13923316926 VALUES( GENERATE_UNIQUE())
5 13156703141 SELECT DATE(MAX(lt.Time)) AS “Date” , lt.acc_num , lt.IP , MAX(
6 10642076225 select a.ACC_NUM as CustomerId ,a.DOB as CustomerDateOfBirth f
7 5150965819 WITH target AS ( SELECT segment_code, minimum, maximum, state,
8 4601218295 SELECT h.reward_ext_account_id, SUM(h.wager_amount) AS wager_am
9 2582440580 SELECT HEX(Trans_Num) AS Trans_Num, Acc_Num, Trace_Type, Type_D
10 2322480497 SELECT Acc_Num, HEX(Client_Id) AS ClientId, Casino_Id, Password
Top 10 statements by TOTAL_CPU TIME per exec
# TOTAL_ STMT_TEXT
CPU_TIME
— ———– —————————————————————
5 257974571 SELECT DATE(MAX(lt.Time)) AS “Date” , lt.acc_num , lt.IP , MAX(
11 31699403 select b.CASINO_ID productCode ,case b.CASINO_ID when ‘LS’ the
12 31137800 select b.CASINO_ID productCode ,case b.CASINO_ID when ‘LS’ the
13 30310994 select b.CASINO_ID productCode ,case b.CASINO_ID when ‘LS’ the
14 29718191 select b.CASINO_ID productCode ,case b.CASINO_ID when ‘LS’ the
15 28828984 select b.CASINO_ID productCode ,case b.CASINO_ID when ‘LS’ the
16 27643376 select a.CASINO_ID productCode ,case a.CASINO_ID when ‘LS’ the
17 24991360 select sum(new_cust) new_customers, sum(today_purchase) purchas
18 23088148 select a.CASINO_ID productCode ,case a.CASINO_ID when ‘LS’ the
19 22058541 select ca.ACC_NUM,HAS_PURCHASE,NEW_CAMPAIGN_ID,ACC_STATUS,
Top 10 statements by TOTAL_ACT_WAIT_TIME
# TOTAL_ACT LOCK_WAIT STMT_TEXT
_WAIT_TIME _TIME
— ———– ———– ————————————————–
— More —
The default collection interval for MONREPORT is 10 seconds. Although there are a few more report options with MONREPORT I find these two presented are the ones most often used. The DBSUMMARY option provides some good info on bottlenecks but you will almost always find that writing to logs has the most wait time.
This is just a brief overview of two monitoring facilities provided with Db2. You’ll want to make sure you are familiar with them and using them. For a complete description of MONREPORT options go here: